All work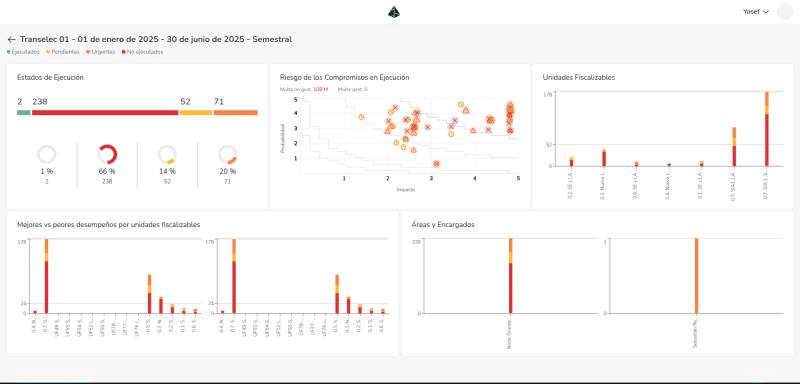
Smart Compliance · Aug 2024 – Oct 2025
Real-time compliance dashboard
A platform where companies list and monitor their environmental-regulation dashboards in real time.
Data visualization
- A dashboard of many interactive Recharts charts, responsive from wall-sized monitors down to mobile.
- A heat-map of 10k–20k points. I grouped nearby points with BFS clustering and used a D3 repel force so labels stay readable.
Performance and state
- Fetched data with Apollo Client and used reactive variables for shared state.
- Used debounce and throttle to cut server load, and kept React Context from causing extra re-renders.
- Wrote end-to-end tests with Playwright.